NPV & IRR – Using MS Excel

Two important concepts that will be taught in any corporate finance module will be Net Present Value (NPV) and Internal Rate of Return (IRR). Both are investment appraisal techniques that are used to assess investment opportunities by businesses. Understanding both, and the relationship between them, is crucial for any finance student. To do this, students should first have a core understanding of the principle of the time value of money.
Net Present Value (NPV)
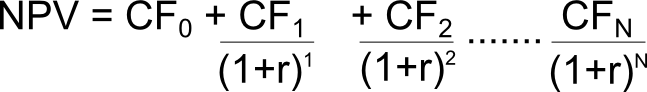
NPV is an investment appraisal technique that looks to forecast the future expected cashflows (as distinct from accounting profits) of an investment and discount these using an appropriate discount rate (also referred to as the required rate of return or cost of capital). This discount rate should be reflective of the risk of the investment opportunity. The present value of each of the expected cashflows from the investment are then summed together (including any initial capital outlay) to determine the NPV. The NPV result will be a € amount.
If the NPV is a positive amount then the investment should be accepted (as the return the investment provides (see IRR below) is in excess of the required rate of return).
If the NPV is a negative amount then the investment should not be accepted (as the return the investment provides (see IRR below) is less than the required rate of return).
Internal Rate of Return (IRR)
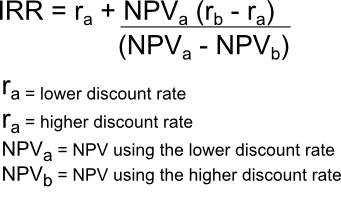
The IRR is the annual percentage rate of return that an investment actually returns over the life of the investment. It is expressed in % terms. It is possible to calculate the IRR using excel (See more below) however, in most exam settings students will instead be asked to use an interpolation formula to estimate the true IRR. This interpolation estimate takes two points on the NPV curve (eseenitally a curve plotting the NPV of the project for various different discount rates) and assumes a straight line between them to determine where it crosses the X-axis (i.e. where the NPV equals zero) whichs gives you the IRR. See the excel section below for a graphical example.
NPV & IRR
The concepts of NPV and IRR are closely related. The IRR is the discount rate that would result in the NPV being zero. In NPV you use a target rate of return to discount the future cashflows to a present value. If the NPV is positive you accept the project and if the NPV is negative you reject the project. An alternative way of looking at the NPV results in relation to the IRR is as follows;
- If NPV is positive – this suggests the actual IRR of the project (i.e. the actual return it makes) is in excess of the target rate of return used in your NPV calculations
- If NPV is negative – this suggests the actual IRR of the project (i.e. the actual return it makes) is less than the target rate of return used in your NPV calculations
NPV & IRR in Excel
See excel file here used for the example below.
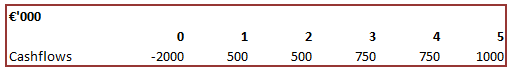
MS Excel provides a variety of functions to accurately calculate the NPV and IRR of an investment. The graph below outlines the NPV profile (i.e. the NPV result at various required rates of return) for a particular project with the below cashflow profile.
You will note that the NPV is negatively related to the discount rate used (i.e. higher the discount rate lower the NPV) and that it is not a simple linear relationship (i.e. it is curved). Due to this non-linear rlationship we need to use the inetrpolation formula (see above) to estimate the IRR.
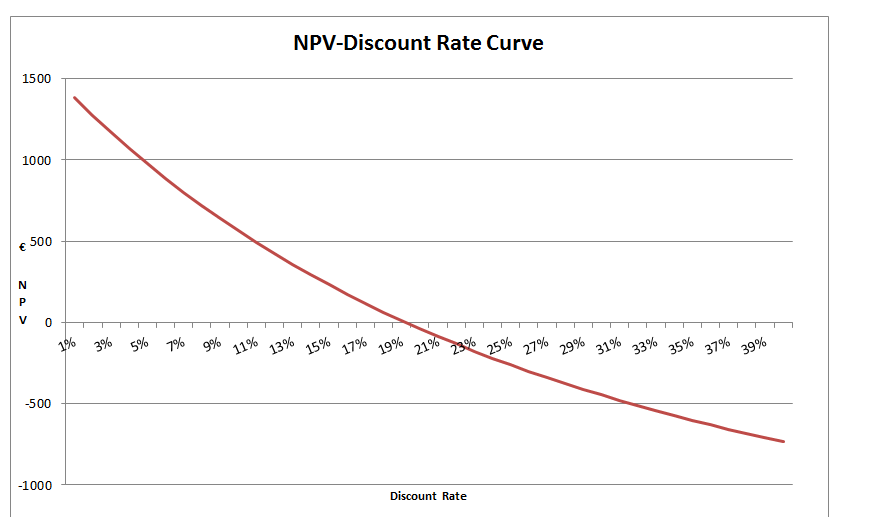
Using the excel IRR() function we can calculate accurately the IRR of this project is 19.2% (see cell C21).
However, using the interpolation formula and two discount rates of 10% and 30% we get an estimate of the IRR of 21.2%. The reason for the difference, as highlighted in the graphic below, is that the accuracy of our estimate is dependent on which discount rates we use in our calculation. The linear interpolation takes two points and draws a line (see blue line below) between them to estimate the IRR (i.e. the point at which the NPV curve cross the X-axis). The closer our points are to the true answer the more accurate the estimate (as the line more accurately reflects the true shape of the curve between those points).
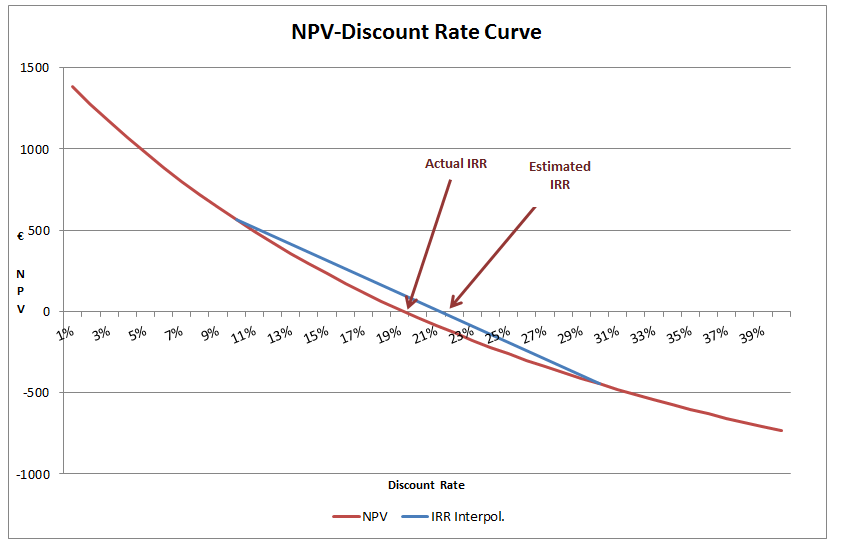
You should download the excel file and change the two discount rates to, say, 15% and 20% (see cells C11 & D11) and notice how much closer your estimate is now – also notice the change in the blue line in the graphic. Students shouldn’t be too worried about which discount rates to choose in the exam. The best gudiance is to choose one discount rate that gives a positive NPV and one that gives a negative NPV (as this ensures your esimate line will cross the X-axis as intended).
no comments